#stockmarket #trading #tradingtips #bitcoin #bitcointrading #bitcointrading #financialfreedom #FinancialIndependence #tradingindicators
In the world of trading, making informed decisions is key to success. Whether you’re a seasoned trader or just getting started, the Relative Strength Index (RSI) is one of those tools that can significantly enhance your ability to analyze market conditions and predict potential price movements. In this blog post, we’ll dive into what RSI is, how it works, and how you can use it to your advantage.
What is RSI?
The Relative Strength Index, commonly known as RSI, is a momentum oscillator that measures the speed and change of price movements. Developed by J. Welles Wilder, RSI is a versatile tool that can be applied across various markets—stocks, commodities, forex, and more.
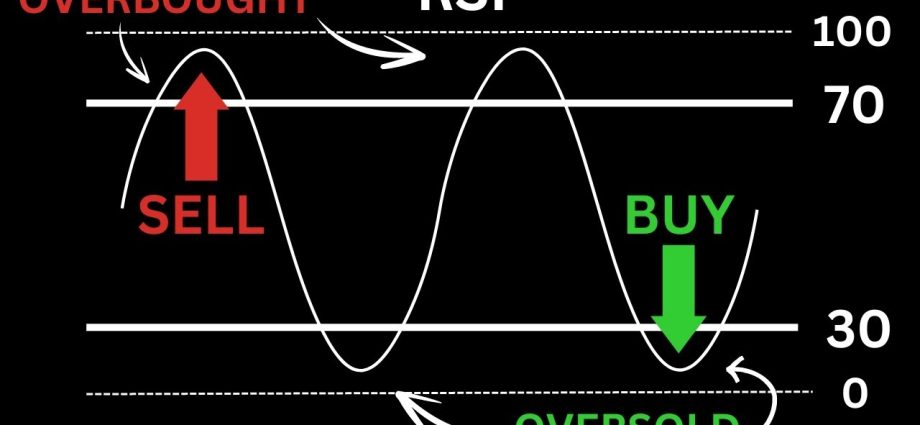
RSI values range from 0 to 100, and it’s primarily used to identify whether an asset is overbought or oversold:
- Overbought: An RSI reading above 70 indicates that the asset might be overbought, meaning it has been heavily purchased and could be due for a price correction.
- Oversold: An RSI reading below 30 suggests that the asset might be oversold, meaning it has been heavily sold off and could be poised for a rebound.
How to Use RSI in Your Trading Strategy
Now that we know what RSI is, let’s explore how you can use it to make more informed trading decisions.
1. Identify Overbought and Oversold Levels
One of the most straightforward ways to use RSI is to look for overbought and oversold levels:
- Overbought Levels (Above 70): When the RSI is above 70, it suggests that the asset has been heavily bought and might be due for a price pullback. This is often a signal to consider selling or avoiding new buys.
- Oversold Levels (Below 30): When the RSI falls below 30, it indicates that the asset has been heavily sold and could be nearing a bottom. This is often a signal to consider buying or holding.
2. Confirm with Other Indicators
While RSI is powerful on its own, it’s often best used in combination with other technical indicators to confirm signals. For example, pairing RSI with Moving Averages or the MACD (Moving Average Convergence Divergence) can provide a more comprehensive view of market conditions.
- Example: If the RSI indicates that an asset is oversold, but a Moving Average crossover suggests a potential uptrend, this could be a strong buy signal.
3. Adjust Time Frames to Suit Your Style
RSI can be applied to different time frames depending on your trading style. Shorter time frames (e.g., 5-minute or 15-minute charts) may provide more frequent signals but can be more volatile. Longer time frames (e.g., daily or weekly charts) may provide more reliable signals but less frequently.
- Tip: Experiment with different time frames to see which works best for your trading strategy. A day trader might find value in shorter time frames, while a swing trader might prefer longer ones.
Why RSI is a Must-Have in Your Trading Toolkit
RSI is not just a tool for identifying potential entry and exit points; it’s also a valuable gauge of market momentum. By understanding how to read and interpret RSI, you can avoid common pitfalls like buying into a market that’s about to reverse or selling at the bottom of a dip.
RSI’s simplicity and effectiveness make it a must-have indicator for any trader looking to improve their market analysis. Whether you’re trading stocks, forex, or any other asset, RSI can provide valuable insights that can lead to more successful trades.
Want to Dive Deeper?
If you’re eager to learn more about RSI and see it in action, I’ve created a detailed video tutorial that walks you through everything we’ve covered here—and more! In the video, you’ll get a hands-on demonstration of how to apply RSI in real trading scenarios, interpret it, and use it to enhance your trading strategy.
Watch the Video Here: Understanding RSI – Your Go-To Tool for Trading
Conclusion
Mastering RSI can take your trading to the next level by providing you with a clearer picture of market momentum and potential price reversals. By incorporating RSI into your trading strategy, you can make more informed decisions and improve your chances of success.
If you have any questions or would like to share your experiences using RSI, feel free to leave a comment below or join the discussion on our forum. Let’s continue to learn and grow together!
Happy trading!
See more videos
